

20 Jun Back To The Future With Cyber Threat Maps
Visual tools allow users to see what is going on in cybersecurity around the world
 – Steve Morgan, Editor-in-Chief
Sausalito, Calif. – Nov. 8, 2019
In the iconic 1983 movie War Games, a high school student (played by Matthew Broderick) hacks into a military supercomputer and activates the U.S. nuclear arsenal, at a time when most people didn’t know what hacking was. The backdrop? Large screen cyberspace maps tracking real-time electronic warfare activity.
Now, 36 years after the release of War Games, the latest real-time cyberthreat maps look pretty much the same. To some cybersecurity experts, these maps are nothing more than eye candy, while others believe there’s something to be learned from them.
We’ll let readers decide for themselves about what useful data might be gleaned from the most popular maps. Each one, provided by a cybersecurity company, has a graphical user interface with a different spin on the same idea — visualize global hacking activity.
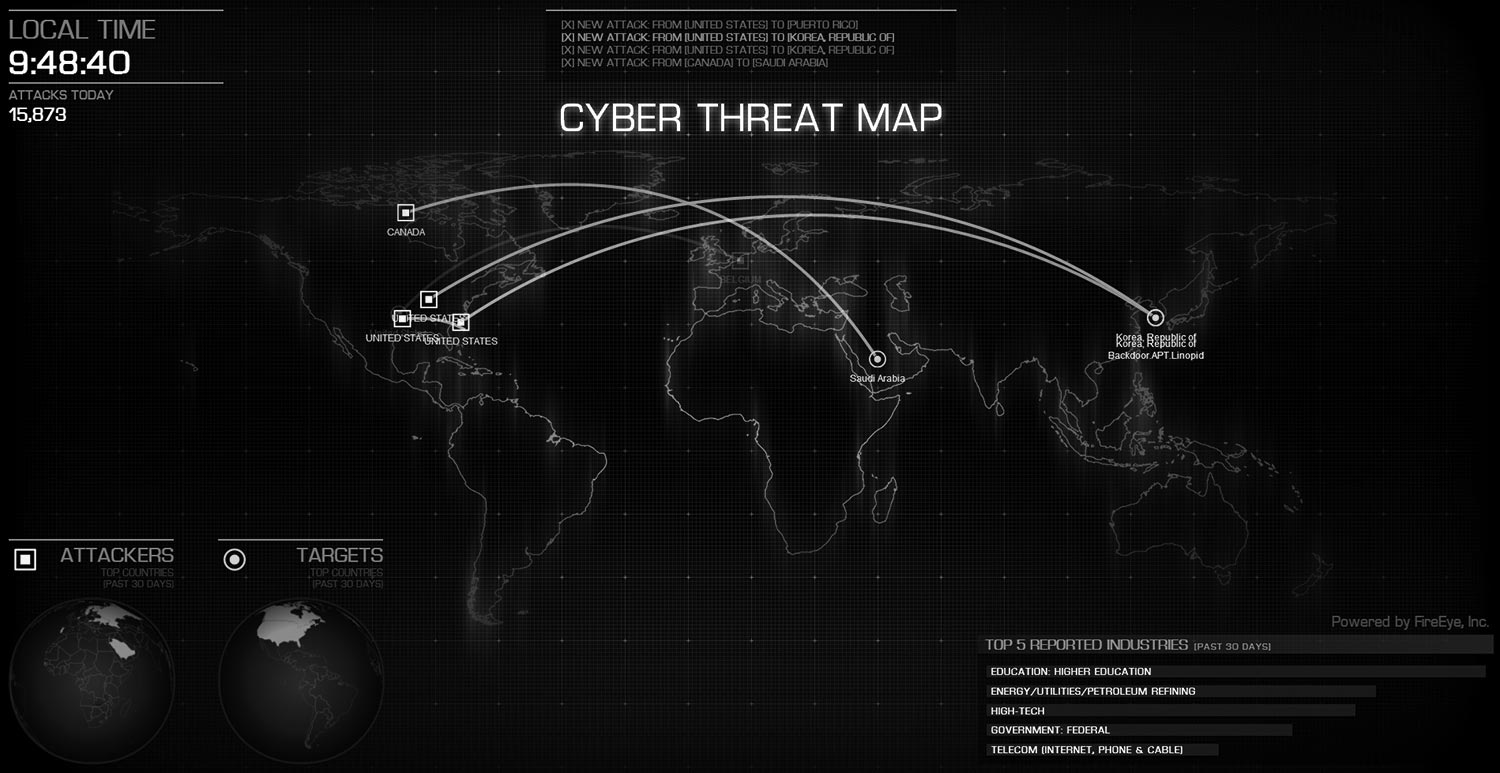
Ruth Bashinsky, senior editor at Cybercrime Magazine, is seated behind the FireEye cyber threat map — which is based on a subset of real attack data, and optimized for better visual presentation.
CYBERTHREAT MAPS
Some of the best visuals on global hacking activity:
- Bitdefender Cyberthreat Real-Time Map — From Bitdefender, headquartered in Bucharest, Romania, with a team of 800+ engineers and researchers, this map provides an insight into today’s cyber attacks and infections that are occurring globally.
- Blueliv Cyberthreat Map — An interactive cyber threat map which shows in real time the geolocation of cybercrime servers that are actively engaged in criminal activity such as credit card theft, credential theft or malware distribution.
- Checkpoint Software Live Cyber Attack Threat Map — Provides real-time tracking of cyber attacks as they’re launched around the world, powered by Checkpoint Software’s ThreatCloud Intelligence, the largest collaborative network to fight cybercrime which delivers threat data and attack trends from a global network of threat sensors.
- FireEye Cyber Threat Map — Includes cyber attack data on the top 5 reported industries, powered by FireEye Labs, the threat research and analysis division of FireEye, Inc., which includes a team of security experts who continuously monitor and analyze threats detected by more than 1 million virtual machines.
- Fortinet Threat Map — This map console displays network activity by geographic region. A visual list of threats is shown at the bottom, displaying the location, severity, and nature of the attacks. The color gradient of the darts on the map indicate the traffic risk, where red indicates the more critical risk.
- LookingGlass Threat Map — This real-time map shows actual data from the LookingGlass threat intelligence feeds including: Cyveillance Infection Records Data Feed; Cyveillance Malicious URL Data Feed; and Cyveillance Phishing URL Data Feed.
- NETSCOUT Cyber Threat Horizon — A global cybersecurity situational awareness platform that provides organizations with highly contextualized visibility into ‘over the horizon’ threat activity on the landscape. Built and operated by the NETSCOUT Threat Intelligence Team.
- ThreatMetrix Cybercrime Threat Map — A live stream of fraud attempts prevented by the ThreatMetrix Digital Identity Network. After a few seconds the map updates with the feed highlighting the origin of account takeover attempts, payment fraud and identity spoofing attempts.
ONE TO WATCH
The Kaspersky Lab Cyberthreats Real-Time Map is a visual tool that allows users to see what is going on in cybersecurity around the world in real time.
Stay tuned for an updated list of cyberthreat maps!
– Steve Morgan is founder and Editor-in-Chief at Cybersecurity Ventures.
Go here to read all of my blogs and articles covering cybersecurity. Go here to send me story tips, feedback and suggestions.
